The Nifty is 14% below its January high. Smallcaps lost 7% in one week
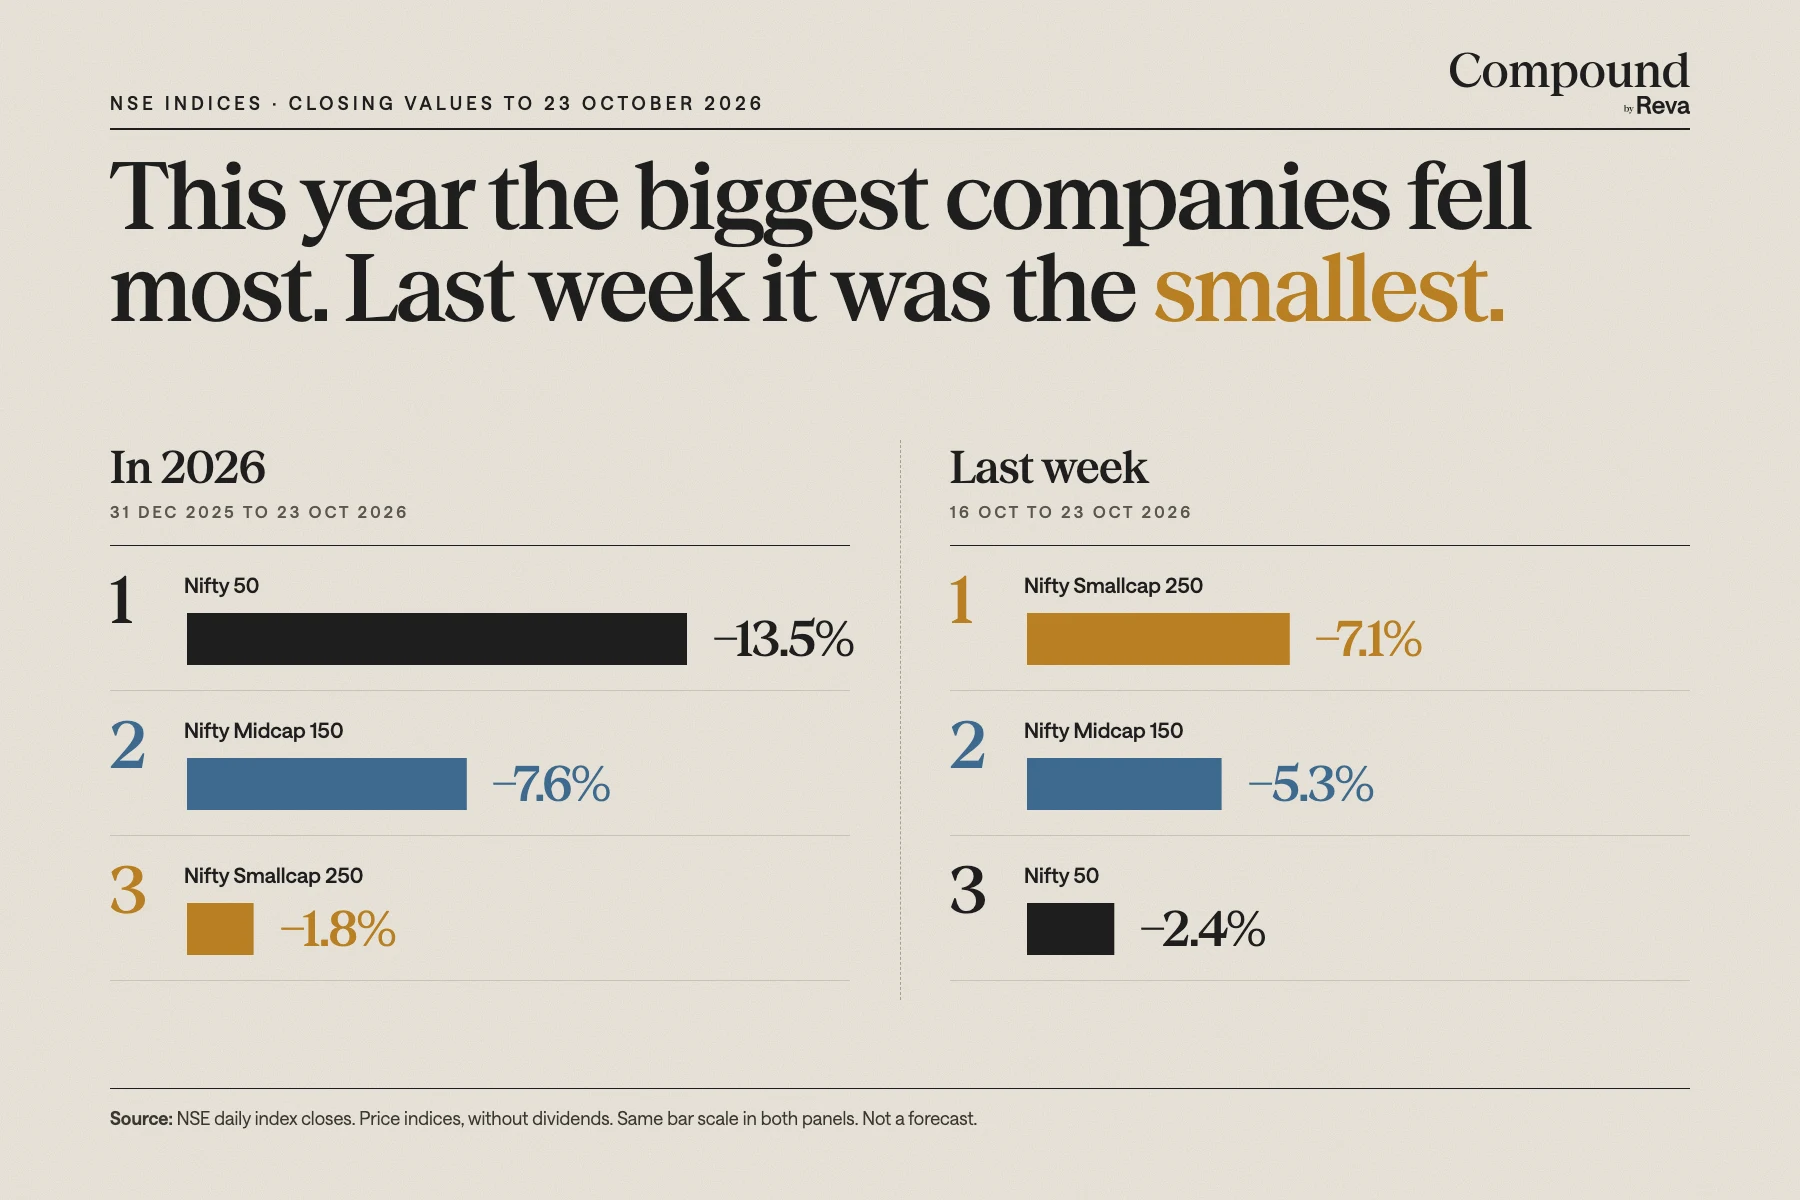
Large companies have fallen the most in 2026: the Nifty 50 is down 13.5% this year, against 1.8% for the Nifty Smallcap 250. In the week to 23 October, the order flipped, and smallcaps fell three times as far as the Nifty.
The Nifty 50 closed at 22,600 on 23 October 2026, 14.2% below its close of 26,328.55 on 2 January, by NSE's daily index data. In 2026 it is down 13.5%, more than midcaps (7.6%) and smallcaps (1.8%). In the week to 23 October, the Nifty Smallcap 250 fell 7.1%, the Midcap 150 5.3% and the Nifty 50 2.4%.
Was this forwarded to you? Sign up to get Compound in your inbox.
The Nifty 50 closed at 22,600 on Friday, 23 October 2026. Its highest close in NSE's data since January 2024 was 26,328.55, on 2 January 2026. The index is 14.2% below that level.
For most of this year, the fall was led by India's largest companies. Last week, smaller companies fell faster.
Where each index stands
| Index | Highest close since Jan 2024 | Close on 23 Oct 2026 | From that high | In 2026 |
|---|---|---|---|---|
| Nifty 50 | 26,328.55 (2 Jan 2026) | 22,600.00 | -14.2% | -13.5% |
| Nifty Next 50 | 77,813.25 (27 Sep 2024) | 65,828.60 | -15.4% | -5.1% |
| Nifty Midcap 150 | 23,539.35 (13 Aug 2026) | 20,592.75 | -12.5% | -7.6% |
| Nifty Smallcap 250 | 18,623.15 (23 Sep 2024) | 16,385.15 | -12.0% | -1.8% |
| Nifty 500 | 24,496.90 (26 Sep 2024) | 21,427.60 | -12.5% | -10.2% |
"In 2026" compares each close with the close on 31 December 2025.
The Nifty 50 has fallen further in 2026 than the midcap and smallcap indices.
The last week
| Index | 16 Oct close | 23 Oct close | Change |
|---|---|---|---|
| Nifty 50 | 23,146.15 | 22,600.00 | -2.4% |
| Nifty Midcap 150 | 21,736.75 | 20,592.75 | -5.3% |
| Nifty Smallcap 250 | 17,637.65 | 16,385.15 | -7.1% |
Smallcaps had climbed back to 18,527.20 on 8 September, close to their 2024 high. They are 11.6% below that September close now. Most of that fall came in the four trading sessions after 16 October; NSE has no index file for 20 October.
Price against earnings
NSE also publishes each index's P/E, the index price divided by the trailing earnings of its companies.
- The Nifty 50's P/E was 22.92 on 2 January. On 23 October it was 19.05.
- The Nifty Midcap 150's was 26.42 on 23 October.
- The Nifty Smallcap 250's was 31.20 on 23 October.
A lower P/E means investors are paying less for each rupee of past earnings. It says nothing about where prices go next.
What this looks like on ₹5 crore
Illustration. Take a hypothetical ₹5 crore that moved exactly with one index from 31 December 2025 to 23 October 2026.
| If it followed | Value on 23 Oct 2026 |
|---|---|
| Nifty 50 | ₹4.32 crore |
| Nifty 500 | ₹4.49 crore |
| Nifty Midcap 150 | ₹4.62 crore |
| Nifty Smallcap 250 | ₹4.91 crore |
These are price indices. They leave out dividends, and no real portfolio matches an index exactly.
What the figures do not show
- Why. The data shows how far prices moved, not the reasons. Compound looked at one part of the picture, who sold and who put money in, from NSDL and AMFI data.
- Your own return. Your funds, your entry dates and your SIPs decide your number. Reva works it out from your statements as an XIRR.
- What comes next. A fall of 14% from a high has no bearing on the next month's move in either direction.
We post the charts behind these pieces on X (@revaprivate) and LinkedIn, and every new piece on our WhatsApp channel. Follow along to get them first.
Questions
- How much has the Nifty 50 fallen from its high?
- It closed at 22,600 on 23 October 2026, 14.2% below its close of 26,328.55 on 2 January 2026, by NSE's daily index data.
- How much has the Nifty fallen in 2026?
- 13.5%, from 26,129.60 on 31 December 2025 to 22,600 on 23 October 2026.
- Which fell more in 2026, large caps or small caps?
- Large caps. The Nifty 50 is down 13.5% this year, the Nifty Midcap 150 7.6% and the Nifty Smallcap 250 1.8%, as of 23 October.
- How much did smallcaps fall in the week to 23 October 2026?
- The Nifty Smallcap 250 fell 7.1%, from 17,637.65 on 16 October to 16,385.15 on 23 October.
- What is the Nifty 50 P/E now?
- NSE put it at 19.05 on 23 October 2026, down from 22.92 on 2 January 2026.
Sources
- NSE, daily closing values of all indices (ind_close_all), 23 Oct 2026
- NSE, daily closing values of all indices, 16 Oct 2026
- NSE, daily closing values of all indices, 31 Dec 2025
- NSE, daily closing values of all indices, 2 Jan 2026 (Nifty 50 high)
- NSE, daily closing values of all indices, January 2024 to October 2026 (highs)
Compound is analysis, not investment advice. Reva Money is not a SEBI-registered investment adviser.