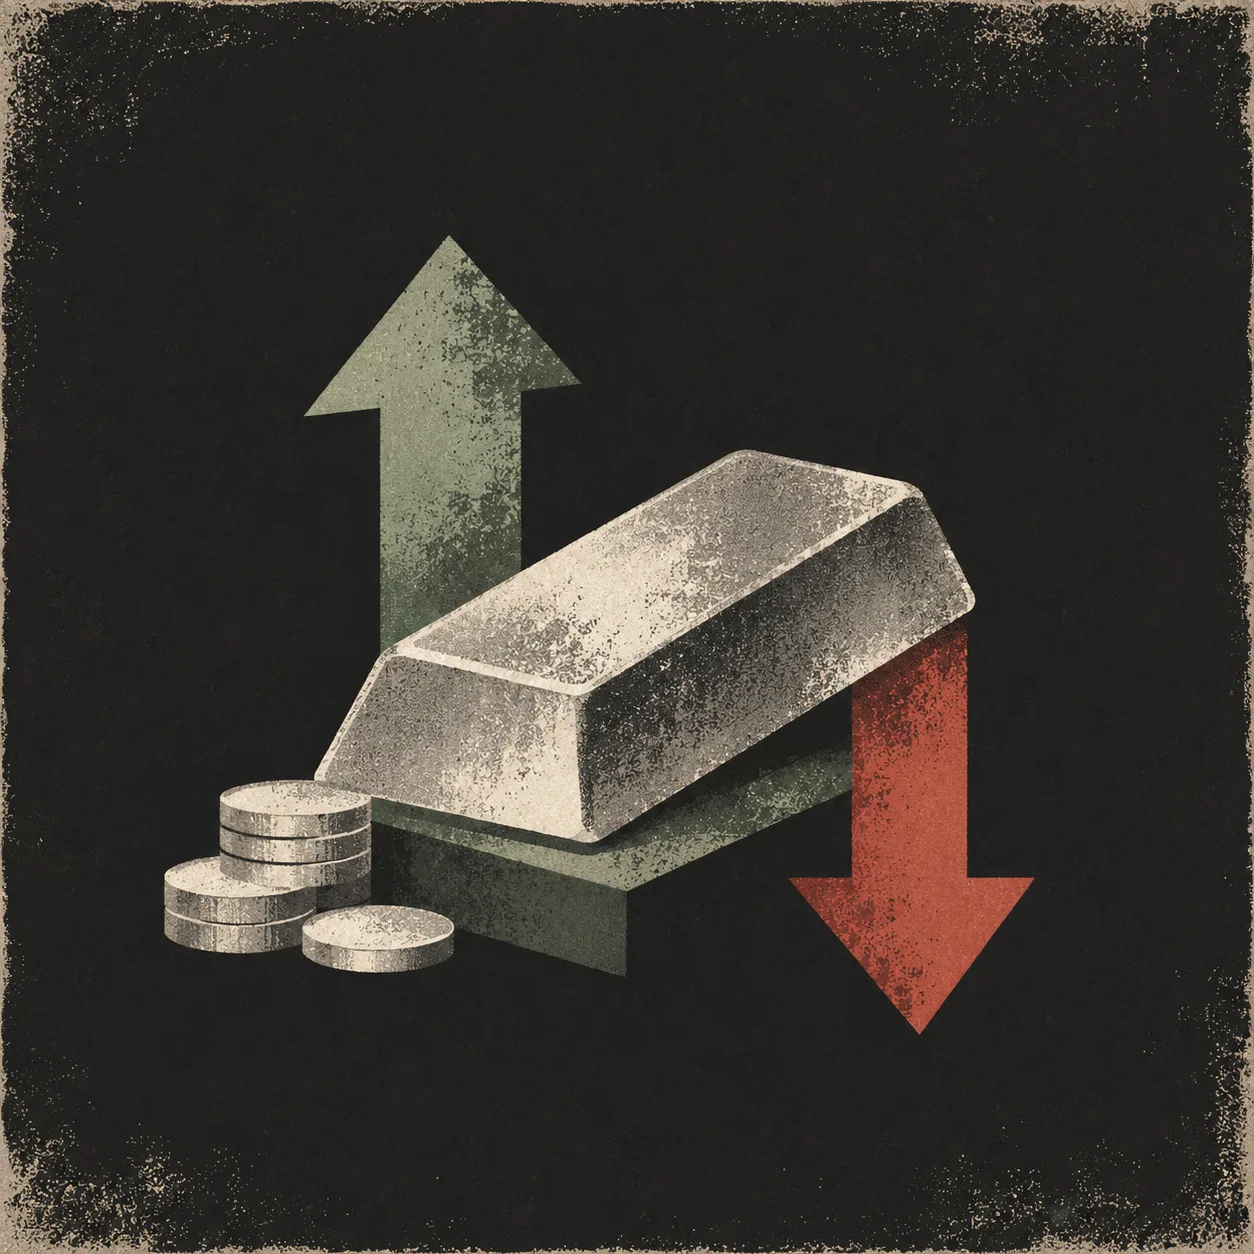
Gold falls over 2% as hot US inflation lifts rate hike bets
In rupees, gold is still up 16% on a year ago and nearly 19% below January's record. Indians put more into gold ETFs in that record month than in the eight months since.
Spot gold fell about 2.1% to $4,053 an ounce on 10 November after US prices rose 0.4% in October, against 0.3% expected. IBJA's 999 gold rate of ₹1,42,420 per 10 grams is 18.77% below January's record and 16.32% above a year earlier. Indians put ₹24,040 crore into gold ETFs in January alone, more than in the eight months since.

Was this forwarded to you? Sign up to get Compound in your inbox.
At 8:30 in the morning in Washington on Tuesday, the US Bureau of Labor Statistics put out one number. Consumer prices rose 0.4% in October.
Economists polled by Reuters had expected 0.3%. Within hours, spot gold fell about 2.1% to close near $4,053 an ounce. At its worst, Reuters had it down 2.8%.
In India it was 7 pm, after IBJA had set the day's rate.
Why a US number moves your gold
Gold pays no interest. When prices in the US run hotter than expected, markets start to price in higher US interest rates. Higher rates make interest-paying assets more attractive and lift the dollar. Gold, priced in dollars, usually gives ground on both counts.
None of this came from Indian buyers or sellers. The move started with the US data.
Where gold stands in rupees
The rate most Indian banks and NBFCs use is IBJA's, the India Bullion and Jewellers Association. RBI also uses it to set gold bond prices. Here is 999 gold, per 10 grams, without GST or making charges.
| Date | IBJA 999 gold | Change to 10 Nov 2026 |
|---|---|---|
| 10 Nov 2025 | ₹1,22,441 | +16.32% |
| 31 Dec 2025 | ₹1,33,195 | +6.93% |
| 29 Jan 2026, the record | ₹1,75,340 | −18.77% |
| 10 Nov 2026 | ₹1,42,420 |
One caution on that last row. IBJA set the 10 November rate in the morning, before the US data. The fall will show in today's rate.
So gold is up on the year and up since New Year. It is also nearly a fifth below its peak.
The rupee softened the fall
In dollars, gold has fallen further. The London afternoon price on 29 January was $5,405.00 an ounce. Tuesday's close near $4,053 is about 25% lower.
In rupees the fall is closer to 19%. Part of the difference is the rupee itself. RBI's reference rate was ₹91.96 to the dollar on 29 January and ₹93.86 on 9 November. Each dollar of gold now costs about 2% more in rupees.
So the same fall in the dollar price takes a little less off the rupee price.
What ₹1 crore in January looks like now
Take ₹1 crore of gold bought at IBJA's record rate on 29 January.
- At the 10 November rate, it is worth about ₹81.23 lakh.
- That is a paper loss of about ₹18.77 lakh.
- The same ₹1 crore put in a year earlier, on 10 November 2025, would be worth about ₹1.16 crore.
What Indian investors did after the peak
AMFI's monthly reports show what happened next. These are net inflows into gold ETFs, money in minus money out.
| Month | Net inflow into gold ETFs |
|---|---|
| October to December 2025 | ₹23,132 crore |
| January 2026 | ₹24,040 crore |
| February to September 2026 | ₹21,885 crore |
January, the month gold peaked, brought in more money than the eight months that followed put together. The heaviest buying came when the price was highest.
But they did not leave. Only one month since, May 2026, saw more money go out than come in, and only by ₹725 crore. Gold ETF folios rose from 1.14 crore in January to 1.27 crore in September. September's inflow of ₹4,451 crore was the highest in seven months.
AMFI's October figures were not out when this was written.
What this means for a household
For most families gold is not one holding. It is jewellery in a locker, a sovereign gold bond, an ETF in a demat account and perhaps a gold fund through a distributor.
A 2% day touches all of them. But each one was bought at a different price, on a different date. Your own gain or loss on gold depends on that mix.
We post the charts behind these pieces on X (@revaprivate) and LinkedIn, and every new piece on our WhatsApp channel. Follow along to get them first.
Questions
- Why did gold fall on 10 November 2026?
- The US Bureau of Labor Statistics reported that consumer prices rose 0.4% in October, against the 0.3% economists polled by Reuters expected. Markets priced in higher US interest rates and a stronger dollar, and spot gold fell about 2.1% to near $4,053 an ounce.
- How far is gold below its record in rupees?
- IBJA's 999 gold rate was ₹1,42,420 per 10 grams on 10 November 2026, 18.77% below the record ₹1,75,340 of 29 January 2026. The 10 November rate was set before the US data, so the fall shows in the next day's rate.
- Is gold still up over the past year in India?
- Yes. IBJA's 999 rate of ₹1,42,420 on 10 November 2026 is 16.32% above the ₹1,22,441 of 10 November 2025, and 6.93% above the ₹1,33,195 of 31 December 2025.
- Why has gold fallen less in rupees than in dollars?
- Partly because the rupee weakened. RBI's reference rate went from ₹91.96 per dollar on 29 January 2026 to ₹93.86 on 9 November 2026, so each dollar of gold costs about 2% more in rupees.
- Did Indians sell gold ETFs after the January peak?
- Mostly not. AMFI's data show ₹24,040 crore of net inflows in January 2026 and ₹21,885 crore from February to September. Only May had a net outflow, of ₹725 crore, and folios rose from 1.14 crore to 1.27 crore.
Sources
- US Bureau of Labor Statistics, Consumer Price Index, October 2026 (released 10 Nov 2026)
- Reuters via MINING.COM, gold falls nearly 3% as CPI tops forecasts (10 Nov 2026)
- USAGold, daily precious metals market report (10 Nov 2026)
- CNBC, gold falls more than 2% as CPI tops forecasts (10 Nov 2026)
- IBJA, opening and closing rates for the last 30 days (to 10 Nov 2026)
- IBJA, Daily Bullion Physical Market Report, 30 Jan 2026 (29 Jan rate, London PM fix $5,405.00)
- IBJA, Daily Bullion Physical Market Report, 11 Nov 2025 (10 Nov 2025 rate)
- IBJA, Daily Bullion Physical Market Report, 1 Jan 2026 (31 Dec 2025 rate)
- RBI, Reference Rate Archive, US dollar (29 Jan and 9 Nov 2026)
- AMFI, monthly reports, October 2025 to September 2026
Compound is analysis, not investment advice. Reva Money is not a SEBI-registered investment adviser.